Black Scholes Option Pricing Model
Understanding the Formula and Its Use for Option Trading
Related Terms:
- What is a Call Option?
- What is a Put Option?
- Best Discount Option Brokers
- How to Turn $4,000 into $20,000 with Options Trading
Definition of the Option Pricing Model:
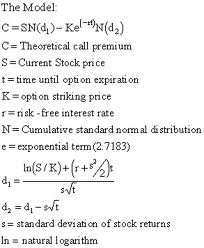
The Option Pricing Model is a formula that is used to determine a fair price for a call or put option based on factors such as underlying stock volatility, days to expiration, and others. The calculation is generally accepted and used on Wall Street and by option traders and has stood the test of time since its publication in 1973. It was the first formula that became popular and almost universally accepted by the option traders to determine what the theoretical price of an option should be based on a handful of variables.
Option traders generally rely on the Black Scholes formula to buy options that are priced under the formula calculated value, and sell options that are priced higher than the Black Schole calculated value. This type of arbitrage trading quickly pushes option prices back towards the Model's calculated value. The Model generally works, but there are a few key instances where the model fails.
The Black Scholes Option Pricing Model:

The Model or Formula calculates an theoretical value of an option based on 6 variables. These variables are:
- Whether the option is a call or a put
- The current underlying stock price
- The time left until the option's expiration date
- The strike price of the option
- The risk-free interest rate
- The volatility of the stock
What you need to know about the Option Pricing Model
For the beginning call and put trader it is NOT necessary to memorize the formula, but it is important to understand a few implications that the formula or equation has for option pricing and, therefore, on your trading.
Here's what you need to know about the formula:
- The formula shows the time left until expiration has a direct positive relationship to the value of a call or put option. In other words, the more time that is left before expiration, the higher the expected price will be. Options with 60 days left until expiration will have a higher price than options that only has 30 days left. This is because the more time that is left, the more of a chance the underlying stock price will move. But here is what you really need to understand--every minute that goes by, the cheaper the option price will become. Think of it this way. As time ticks by and as the days tick by, all things being equal, an option with 60 days left will lose about 1/60th of its value tomorrow when it only has 59 days left. That may not seem like a lot, but when we get to expiration week and as Monday changes to Tuesday, options lose 1/5 of their value. As Tuesday slips into Wednesday of expiration week, options lose 1/4 of their value, etc. so you must be careful! While nothing is certain in the stock market, there is ALWAYS one thing that is certain--time ticks by and options lose their value day by day. Please note: Don't take me literally here as the formula for this "time decay" is more complicated than that. It actually indicates that the "time decay" accelerates as you get closer to expiration, but I hope you get the point.
- The formula suggests the historical volatility of the stock also has a direct correlation to the option's price. By volatility we mean the daily change in a stock's price from one day to the next. The more a stock price fluctuates within a day and from day to day, then the more volatile the stock. The more volatile the stock price, the higher the Model will calculate the value of its options. Think of stocks that are in industries like utilities that pay a high dividend and have been long-term, consistent performers. Their prices go up steadily as the market moves, and they move small percentage points by week. But if you compare those utility stocks' price movements with bio-tech stocks or technology stocks, whose prices swing up and down a few dollars per day, you will know what volatility is. Obviously a stock whose price swings up and down $5 a week has a greater chance of going up $5 then a stocks whose price swings up and down $1 per week. If you are buying options, both put and calls, you LOVE volatility--you WANT volatility. This volatility can be calculated as the variance of the the prices over the last 60 days, or 90 days, or 180 days. This becomes one of the weaknesses of the model since past results don't always predict future performance. Stocks are often volatile immediately after an earnings release, or after a major press release.
- Watch out for dividends! If a stock typically pays a $1 dividend, then the day it goes ex-dividend the stock price should drop $1. If you have calls on a stock that you KNOW will drop $1 then you are starting off in the hole $1. Nothing is worse than identifying a stock you are confident will go up, looking at the call prices and thinking "boy those are cheap", buying a few contracts, and then finding the stock go ex-dividend and then you realize why the options were so cheap.
- Beware of Earnings Releases and Rumors--You can calculate an option price all you want, but nothing can drive a stock price (and its call option prices as well) up more than a positive rumor or a strong earnings release. The Option Pricing Model simply cannot overcome the supply and demand curve of option traders hungry for owing a call option on the day of a strong earnings release or a positive press release.
The Option Pricing Model was developed by Fischer Black and Myron Scholes in 1973.


Here are the top 10 option concepts you should understand before making your first real trade: